TikTok Metrics That Drive Revenue: Vanity vs. Real ROI Analytics & Dashboard Guide
TikTok Metrics That Drive Revenue: Vanity vs. Real ROI Analytics & Dashboard Guide Imagine pouring fuel into a roaring furnace, watching the flames dance...

TikTok Metrics That Drive Revenue: Vanity vs. Real ROI Analytics & Dashboard Guide
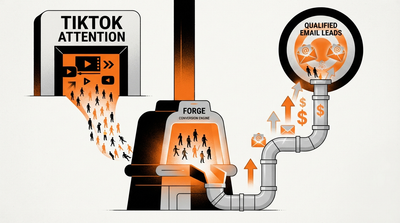
Imagine pouring fuel into a roaring furnace, watching the flames dance higher, only to step back with empty pockets. That's the TikTok grind for too many ambitious brands, coaches, and creators in the US and Canada. Views skyrocket, likes cascade, yet revenue flatlines. The fix? Shift from vanity metrics to the TikTok metrics that matter—the ones engineered for real ROI.
At Viral Foundry, we call this Attention Engineering: forging raw eyeballs into a pipeline of leads and sales. Ditch the dopamine hits of follower counts. Build a dashboard that reveals how your content fuels the furnace of business growth. This guide cuts through the noise with a weekly dashboard blueprint, precise TikTok analytics for revenue attribution, and pipeline-tied strategies. No fluff. Just the industrial blueprint.
Vanity Metrics vs. Real TikTok ROI Measurement: Spot the Difference
Vanity metrics glitter but deliver no heat. Total views? A broad net catching fish you can't sell. Likes and shares? Echoes in an empty forge. Followers? Loyal spectators, not buyers. These numbers spike egos but rarely correlate with revenue. They're surface readings from a thermometer on a cold engine.
Real TikTok metrics that matter measure engagement depth—the molten core where attention hardens into action. Watch time tracks how long viewers linger in your furnace. Completion rate signals if they consume every second. Share rate reveals organic amplification. Profile conversion shows traffic funneled to your domain. Lead volume? The ultimate yield: prospects entering your pipeline.
Vanity metrics count the crowd outside the forge. Revenue metrics weigh the steel produced inside.
The Revenue Core: TikTok Metrics That Drive Revenue
Watch Time – The Sustained Burn
Average watch time is your furnace temperature gauge. Viewers dipping in for 3 seconds? Flickering pilot light. Hitting 70% of video length? Full blaze. Prioritize hooks that pull viewers deeper; this metric predicts virality and retention, directly feeding downstream conversions.
Completion Rate – Full Forge Cycle
Did they watch to the end? This is your process efficiency. High completion (above 60%) means your narrative rivets—no drop-offs mid-build. Test CTAs at the close; completions forge stronger recall and action.
Share Rate – Amplification Leverage
Shares are your viral bellows, multiplying reach exponentially. A 1% share rate on a 100K-view video? 1K organic pushes. Track per-video; content sparking shares accelerates TikTok revenue attribution by expanding qualified audience pools.
Profile Conversion & Lead Volume – Pipeline Intake
Clicks to profile divided by views. Then, leads captured (forms, bookings). These tie TikTok analytics to CRM data, revealing true ROI. A 2% profile conversion yielding 50 weekly leads? That's engineered revenue flow.
Build Your Weekly TikTok Dashboard: The Control Room
Your TikTok dashboard isn't a screenshot collage—it's an industrial control panel. Use native TikTok Analytics (Pro account required) plus Google Analytics or CRM pixels for cross-flow data. Refresh weekly to spot trends before they cool.
- Core Metrics Row: Watch time avg, completion %, share rate, profile visits/views ratio, leads generated.
- Content Buckets: Tag videos by theme (e.g., hooks, testimonials). Column-compare performance.
- Revenue Tie-In: UTM-link videos to landing pages. Track in GA4: sessions > leads > sales.
- Alerts: Flag drops below benchmarks (e.g., watch time <50%).
- Tools: Google Sheets, Notion, or Looker Studio for visualization. Export CSV weekly from TikTok.
Pro tip: Start with Viral Foundry's readiness quiz to benchmark your baseline. Takes 2 minutes; qualifies if your funnel's primed for these metrics.
Tying TikTok Content to Pipeline: Revenue Attribution Blueprint
Content doesn't sell alone—it's the intake valve. Link every video bio to a tracked link (Bitly or UTM). Fire pixels on profile visits and lead forms. In your CRM (HubSpot, etc.), attribute leads to TikTok source. Formula: (Leads x Close Rate x Avg Deal Value) = Attributed Revenue.
- Weekly audit: Which videos drove top lead volume?
- Double down: Replicate formats with 2x benchmark performance.
- Scrap: Cull low performers eating ad budget.
This is TikTok ROI measurement at scale: not guesses, but forged data. Coaches scaling group programs see 3x pipeline growth. Brands hit consistent MRR. Creators? From side-hustle to six-figures.
Ignite Your Forge
Stop chasing shadows. Engineer attention with these metrics. Build the dashboard today. Watch your TikTok furnace yield real revenue—not just heat, but molten profit. The Viral Foundry awaits: scale smarter, not harder.
MORE FROM THE FOUNDRY
Convert TikTok Views to Leads: Unlock the 5-Question Readiness Quiz Funnel
Convert TikTok Views to Leads: Unlock the 5-Question Readiness Quiz FunnelPicture this: your latest TikTok video explodes. A million views roll in overnight....

Turn TikTok Views into Revenue: 4 Proven Monetization Paths for 2026 (TikTok Shop, Affiliates & More)
Turn TikTok Views into Revenue: 4 Proven Monetization Paths for 2026 (TikTok Shop, Affiliates & More)The Harsh Truth: Views Without a Conversion Engine A...

TikTok Live Strategy for Coaches: 4-Part Framework to Land Clients & Leads in 2026
TikTok Live Strategy for Coaches: 4-Part Framework to Land Clients & Leads in 2026Picture this: You hit "Go Live" on TikTok, your heart races with the pr...